Showing posts with label Capsa. Show all posts

Thursday, July 30, 2009

Admin resource: Use the right tools to manage your network

To be an effective network administrator, you don't have to be a scientific genius. And you don't have to memorize a bunch of obscure facts about hardware and software. Instead, you need to know two things:


  • Where to find the appropriate solutions to technology problems when they arise

  • How to use the right tools for monitoring, troubleshooting, and managing the activities of the various systems on your network


We know TechRepublic is the biggest IT community, which provides kinds of sources you turn to for solutions when problems hit your network. To demonstrate that TechRepublic is worthy of being a solutions finder, here I've compiled a list of articles that discuss tools you can use to improve the management of your network.


  • Test-drive: Colasoft Capsa network analyzer

    Having good insight to your network is critical. There are so many potential issues that can be going on that any additional tool can be welcome. This can include attacks, transmissions and applications without encryption, or incorrect configurations bogging down the network.

    Recently, I had a chance to evaluate the Colasoft network analyzer or Capsa.


  • Servers Alive is a valuable and inexpensive uptime monitoring tool"

    To handle a problem, you have to know that it exists. That's where a program such as Servers Alive comes in. It can e-mail, page, or call an administrator with an automated alert when a system goes down, a router fails, or a service goes offline.

  • "Let Big Brother keep tabs on the health of your servers"

    Big Brother is another monitoring tool, but this one runs on Linux/UNIX (although it can monitor systems from other platforms). It's available free under an open source license.

  • "PRTG makes it easy to monitor bandwidth"

    Bandwidth is an expensive and critical commodity for most organizations. PRTG (and its Linux/UNIX cousin, MRTG) allow you to keep a close eye on bandwidth utilization and quickly spot any potential problems.

  • "Get two must-have network tools--for free"

    Here's a peek at two handy troubleshooting tools—HyperTrace and NetStatLive. Since these are small, easy-to-use, and free, there's no excuse not to try them.

  • "Quickly manage systems over KVM with BgInfo"

    Most administrators who manage more than five or 10 servers usually have them loaded into a rack and access them with a KVM switch or remote access software. However, the more servers you have, the harder it can be to tell them apart—and making a configuration change to the wrong server can have disastrous consequences. BgInfo is a little tool that can help you set up desktop screens that allow you to quickly identify your servers.


Final word

Of course, this is not a comprehensive list of every tool you need to manage a network. It's just a sampling of the kinds of great tools that can make you more effective at spotting problems and getting them fixed in a timely fashion.


For more information, please visit:http://articles.techrepublic.com.com/5100-10878_11-5074896.html.
Thursday, July 16, 2009

How to Troubleshoot ARP Attacks with Colasoft Capsa

For Colasoft Capsa you can get an easy use but advanced network traffic monitoring, protocol analysis and diagnosis view software. It is a specialist to help you solve LAN troubles.

ARP, because of its simpleness, fastness, and effectiveness, is becoming increasingly popular among internet raggers, thus causing severe influence to the internet environment.With Colasoft Capsa, we can quickly and accurately locate ARP source when ARP attack happens to the network, so as to ensure normal and reliable network operation.


We have four basic solutions to locate ARP attack with Colasoft Capsa:


  • View ARP diagnosis events in the Diagnosis View;

  • View ARP request and response packets in the Protocol View;

  • View original information of ARP packets in the Packets View;

  • View node information in the Endpoints View;

  • Solution one:

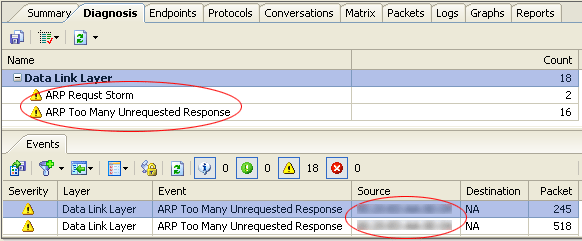
    Diagnosis View is the most direct and effective place to locate ARP attack and should be our first choice. Its interface is displayed as picture1.


    Picture 1 definitely points out that there are two kinds of ARP attack event, ARP Too Many Unrequested Response and ARP Request Storm, in the network, and the attack source is clearly given at the bottom. Meanwhile, Capsa will provide reasons of such ARP attacks and corresponding solutions.


    Solution two:

    The status of ARP packets are displayed in the Protocol View, like in picture 2. Here we must pay special attention to the value of ARP Request and ARP Response. The ratio of ARP Request and ARP Request should be approximately 1:1 under general condition. If there is a great difference between these two values, there may be ARP attacks in the network.


    In picture 2 there are 3484 ARP Request packets but only 507 ARP Response packets, by comparing these two values, we can presume there are ARP attacks in the network.


    Solution three:

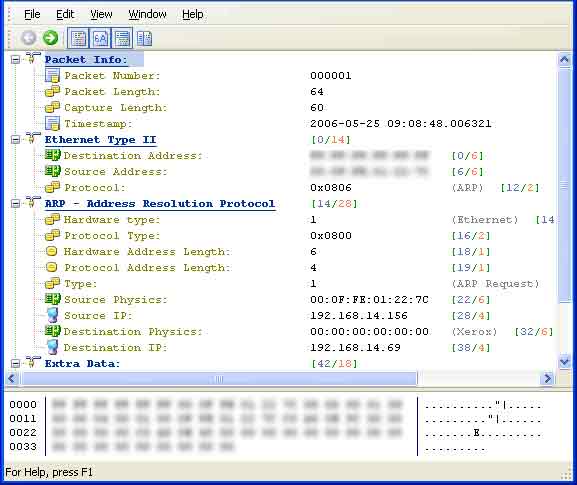
    Packet decoding information in the Packets View can tell us the original information of ARP packets, please look at picture 3.


    (Picture 3)


    By decoding ARP packets, we can find out the source and destination of the ARP packets, the function and the reality of these ARP packets.


    Solution four:

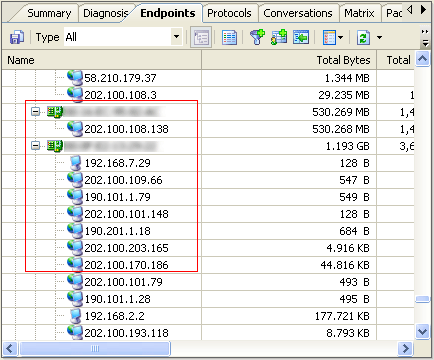
    Identify ARP attack in the Endpoints View. (See picture 4)


    (Picture 4)


    In the Endpoints View we can view the correlation of MAC address and IP address. Generally speaking, one MAC address shall have only one IP address corresponding to it. If one MAC address has multiple IP addresses to it, the condition may be:


    1. the host with the MAC address is the gateway;

    2. these IP addresses are bound to the MAC address manually;

    3. ARP attack


    So, the Endpoints View can also give us a hint to locate ARP attack.


    In addition, the Matrix View allows us to see communication information between those hosts in the network, which helps us to fast identify abnormal conditions and locate the attack source.


    (Matrix View)


    Conclusion


    ARP, as one of the most popular attacks in recent days, may cause severe problems to our network. How to fast troubleshoot ARP attacks is what every network administer concerns. Colasoft Capsa will greatly enhance network administrators’ capability to identify ARP attacks and protect the network from ARP attacks, so as to ensure normal network operation. Besides fast locating ARP attacks, Colasoft Capsa can also analyze network abnormities, locate failure nodes, enhance network security, evaluate and improve network performance.


    Tuesday, June 30, 2009

    How to Troubleshoot Connectivity problems

    This Tips will help you fix Connectivity problems.


    1. Use the ping command to test the basic connectivity. By using the ping command you can isolate network hardware problems and incompatible configurations. By using the path ping you can detect packet loss.


    2. If you want to see the Ping's statistics then you ping -t command and press enter to continue and if you want to stop then press CTRL+BREAKTo watch Ping statistics, use the ping -t command. To see statistics and continue, press CTRL+BREAK. To stop, press CTRL+C. you can use a free network tool--Colasoft Ping Tool, to excute Ping command on multi-computers at the same time, and see detailed Ping statistics.


    3. If you remote system is across the delay link, such as satellite link responses may take longer.


    4. Check the event logs for network card and other hardware and software configurations and connectivity related entries.


    5. Check whether the NIC card is on the Microsoft Hardware Compatibility List (HCL).


    6. Check other computers that use the same gateway and are plugged into the same hub or switch and if these computers do not show any network connectivity problem then the problem is on the only one computer.


    7. Contact the vendor of each NIC and motherboard and update the BIOS.


    8. Replace the network adapter of the system with the good configured system and see if the same error arise again.


    This article is extracted from networktutorials by Colasoft writer.


    About Colasoft Co., Ltd


    Colasoft Co., Ltd is a leading network management and analysis software enterprise. Colasoft Network Analyzer - Capsa, an expert packet analyzer and network sniffing tool, is the flagship of Colasoft product line; its real time capturing, accurate analysis, continuous logs and extended diagnoses for network events, have made it indispensable for network troubleshooting.

    Monday, May 11, 2009

    Top 5 Most Welcome Network Sniffers

    Colasoft Network AnalyzerAccording to the latest statistic from famous download sites regarding to downloads of Network Sniffers softwares, the following products are very honored to be listed as top 5 most welcome packet sniffers by network engineers, IT managers, and network administrators etc.

    #1 Wireshark- A Free Open Source Network Sniffer for Top Network Engineers

    Wireshark (known as Ethereal until a trademark dispute in Summer 2006) is a fantastic open source network protocol analyzer for Unix and Windows. It allows you to examine data from a live network or from a capture file on disk. You can interactively browse the capture data, delving down into just the level of packet detail you need. Wireshark has several powerful features, including a rich display filter language and the ability to view the reconstructed stream of a TCP session. It also supports hundreds of protocols and media types. A tcpdump-like console version named tethereal is included. One word of caution is that Ethereal has suffered from dozens of remotely exploitable security holes, so stay up-to-date and be wary of running it on untrusted or hostile networks (such as security conferences).


    #2 Colasoft Network Sniffer - All-In-One & Easy-To-Use Network Analyzer and Network Sniffer Available For Most Network Administrators.

    Colasoft Network Sniffer - Capsa performs real-time packet capturing, 24/7 network monitoring, advanced protocol analyzing, in-depth packet decoding, and automatic expert diagnosing. It allows you to get a clear view of the complex network, conduct packet level analysis, and troubleshoot network problems.

    Whether you're a network administrator who needs to identify, diagnose, and solve network problems, a company manager who wants to monitor user activities on the network and ensure that the corporation's communications assets are safe, or a consultant who has to quickly solve network problems for clients, Capsa is the tool you need.


    #3 Tcpdump: The Classic Sniffer For Network Monitoring And Data Acquisition

    Tcpdump is the IP sniffer we all used before Ethereal (Wireshark) came on the scene, and many of us continue to use it frequently. It may not have the bells and whistles (such as a pretty GUI or parsing logic for hundreds of application protocols) that Wireshark has, but it does the job well and with fewer security holes. It also requires fewer system resources. While it doesn't receive new features often, it is actively maintained to fix bugs and portability problems. It is great for tracking down network problems or monitoring activity. There is a separate Windows port named WinDump. TCPDump is the source of the Libpcap/WinPcap packet capture library, which is used by Nmap among many other tools.


    #4 Etherdetect : Connection-Oriented Network Sniffer And Protocol Analyzer

    EtherDetect Packet Sniffer is an easy for use and award-winning packet sniffer and network protocol analyzer, which provides a connection-oriented view for analyzing packets more effectively. With the handy tool, all you need to do is to set up the filter, start capturing, and view connections, packets as well as data on the fly.


    #5 Ettercap : In Case You Still Thought Switched Lans Provide Much Extra Security

    Ettercap is a terminal-based network sniffer/interceptor/logger for ethernet LANs. It supports active and passive dissection of many protocols (even ciphered ones, like ssh and https). Data injection in an established connection and filtering on the fly is also possible, keeping the connection synchronized. Many sniffing modes were implemented to give you a powerful and complete sniffing suite. Plugins are supported. It has the ability to check whether you are in a switched LAN or not, and to use OS fingerprints (active or passive) to let you know the geometry of the LAN.

    Thursday, April 23, 2009

    Monitor Your Network Traffic with Colasoft Network Sniffer

    Importance of network monitoring

    Reading network traffic is essential for system administrators, network engineers, and security analysts. At some point there will be a need to read the network traffic directly instead of monitoring application level details. Examples of situations that might require monitoring network traffic are, auditing network security, debugging network configurations, and analyzing usage patterns. For this task we use network monitoring software, or network sniffers, that sniff the traffic your computer is able to see on the network. What exactly your computer can see really depends on how the network is laid out, but the easiest way to figure out what it can see is just start sniffing.

    The most common tool to do the job is readily available. One of the most popular and easy – to - use tool for monitoring network traffic is Colasoft network sniffer,


    How to Monitor Network Traffic

    As a network sniffer, Capsa make it easy for us to monitor and analyze network traffic in its intuitive and information-rich tab views. With Capsa's network traffic monitor feature, we can quickly identify network bottleneck and detect network abnormities. This article is to discuss how we can monitor network traffic with Capsa's network traffic monitor feature.


    1,Monitor network traffic in "Summary" tab

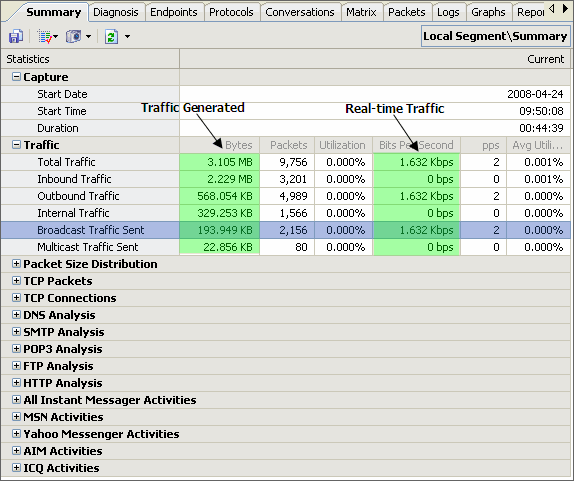
    "Summary" is a view that provides general information of the entire network or the selected node in the "Explorer". In "Summary" we can get a quick view of the total traffic, real-time traffic, broadcast traffic, multicast traffic and so on. When we switch among the node from the explorer, corresponding traffic information will be provided.

    Monitor Network Traffic in Summary

    (pic 1. monitor-network-traffic-in-summary)

    2,Monitor network traffic in "Endpoints" tab

    In "Endpoints" view, we can monitor network traffic information of each node, both local and remote. With its easy sorting feature we can easily find out which host is generating or has generated the largest traffic.

    Monitor Network Traffic in Endpoints

    (pic 2. monitor-network-traffic-in-endpoints)

    3,Monitor network traffic in "Protocols" tab

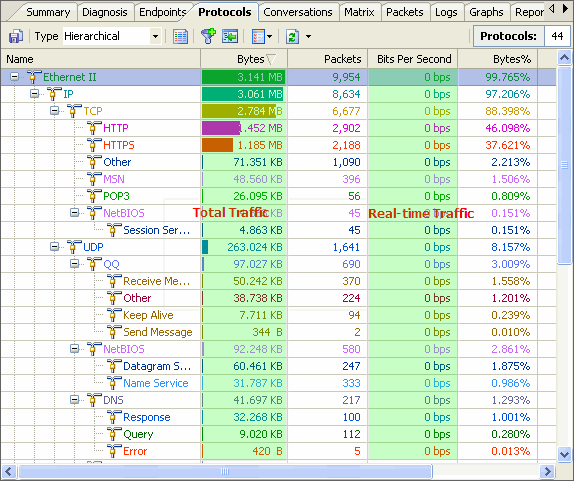
    "Protocols" view will list all protocols applied in network transmission. In "Protocols" view we can monitor network traffic by each protocol. By analyzing network traffic by protocol, we can understand what applications are using the network bandwidth, for example "http" protocol stands for website browsing, "pop3" stands for email, etc.

    Monitor Network Traffic by Protocol

    (pic 3. monitor-network-traffic-by-protocol)

    4,Monitor network traffic in "Conversations" tab

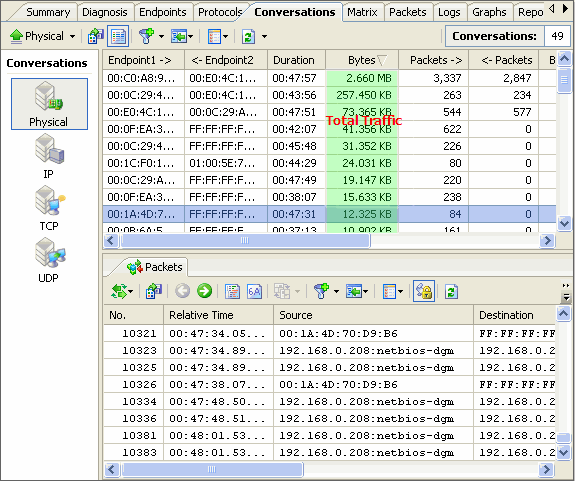
    In "Conversations" tab we can monitor network traffic by each conversation and the figure out which conversation has generated the largest network traffic.

    Monitor Network Traffic by Conversation

    (pic 4. monitor-network-traffic-by-conversation)

    5,Monitor network traffic in "Matrix" tab

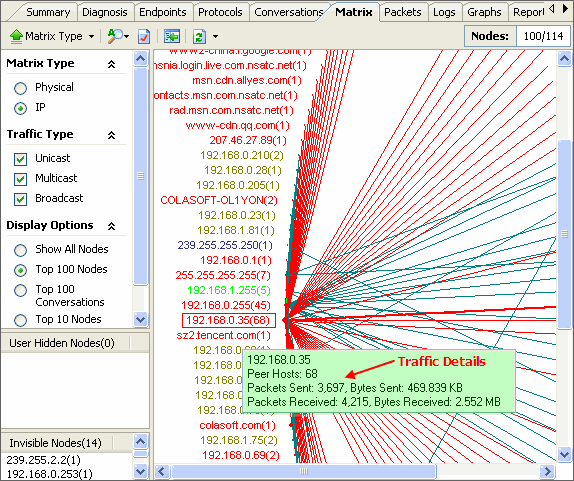
    "Matrix" is a view that visualizes all network connections and traffic details in one single graph. The weight of the lines between the nodes indicates the traffic volume and the color indicates the status. As we move the cursor on a specific node, network traffic details of the node will be provided.

    Monitor Network Traffic In Matrix

    (pic 5. monitor-network-traffic-in-Matrix)

    6,Monitor network traffic in "Graphs" tab

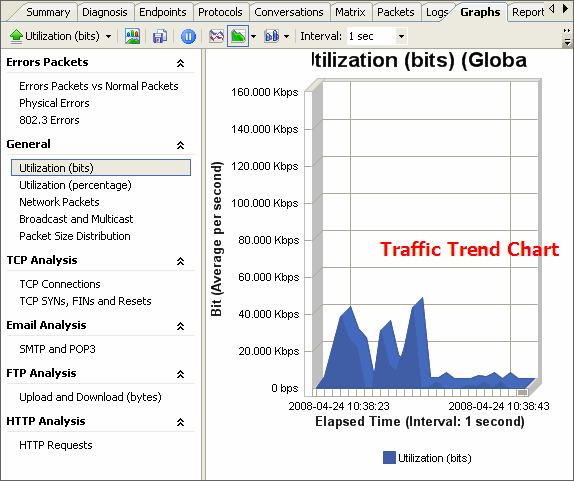
    If we want to get a trend chart of the network traffic, then we need to use the "Graphs" tab. "Graphs" view allows us view network statistics dynamically in different chart types, such as ling chart, bar chart, and pie chart. By selecting "Utilization" we get a real-time traffic trend chart.

    Monitor Network Traffic in Graphs

    (pic 6. monitor-network-traffic-in-graphs)

    As we can see, with Capsa we can not only monitor network traffic in convenience, but also analyze network traffic in deferent levels, thus enables us quickly and efficiently detect network abnormities and troubleshoot network problems.